The Real-Time
Watchkeeper of Plant Activity
Measuring air temperature alone is not enough. Photosynthetically active radiation (PAR), the plant's own temperature, water balance — we observe directly what the plant is experiencing right now.
Configuration Consulting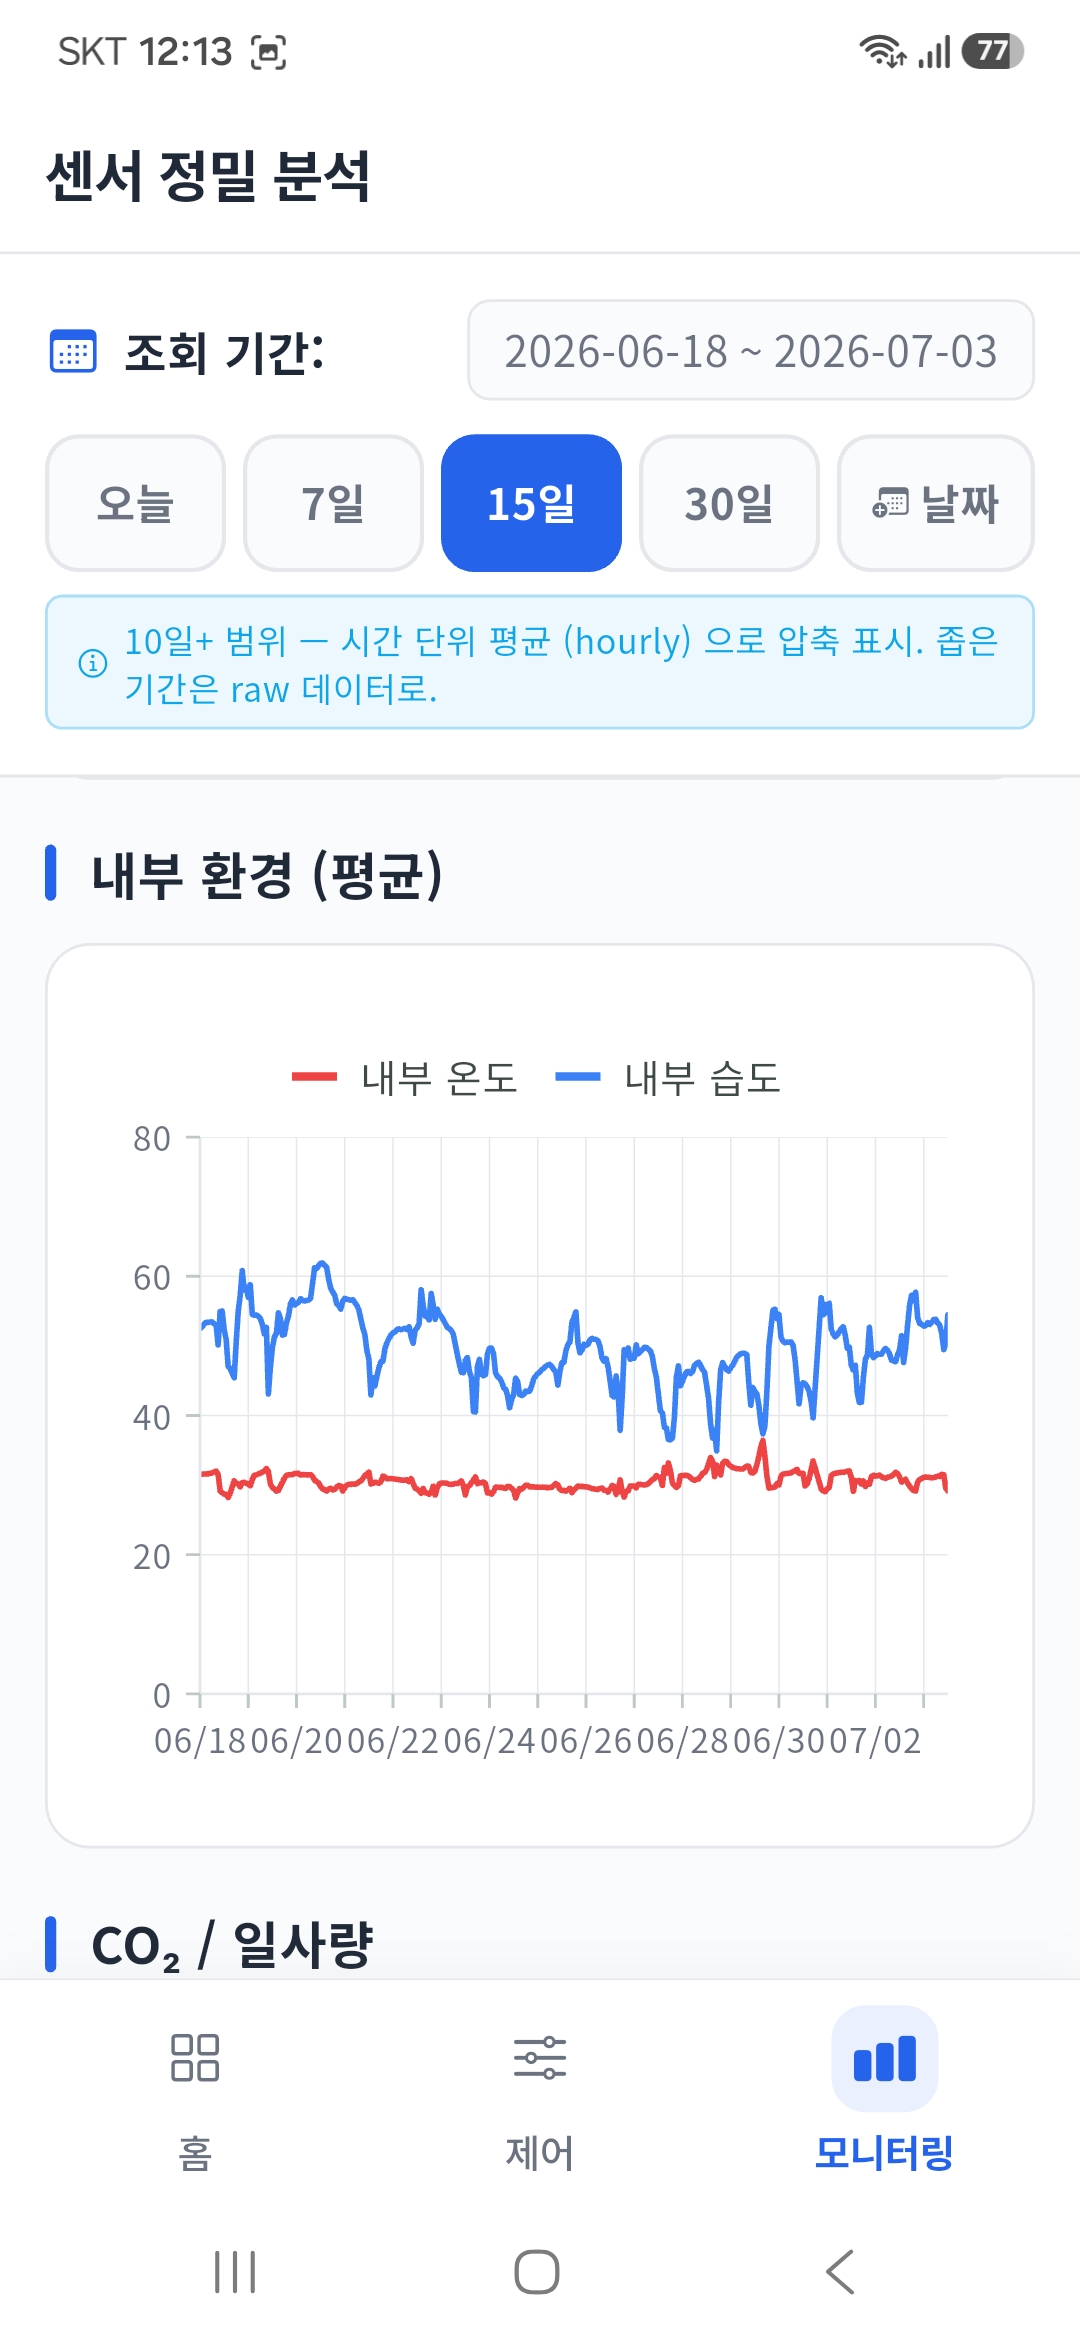
What the Sensors Measure,
Analyzed with Precision
This is a precise sensor analysis screen in live operation. Query inside temperature/humidity, CO₂, and solar radiation by period and read the trends.
- Precise period-based queries — today, 7, 15, or 30 days; long periods are compressed into hourly averages
- Inside environment comparison — temperature, humidity, CO₂, and solar radiation on one screen
- Rapid-change detection — catch abnormal signals immediately
Sensor Lineup
PAR Sensor
Measures photosynthetically active radiation to determine how much light the plant can actually use. The basis for supplemental lighting and shading decisions.
Plant Temperature Sensor
Directly measures the surface temperature of the plant itself, not the air. Prevents climate shock before it happens.
Water Balance Module
Tracks soil moisture and drainage together to support irrigation decisions based on the crop's water requirements.
Weather Station
Wind direction/speed, solar radiation, rainfall, and outside temperature/humidity — observe the weather above your own farm directly.
Nutrient Sensor (EC / pH)
Measures the electrical conductivity and acidity of drainage and nutrient solution in real time. The foundation of precise nutrient management.
Environment Sensor
Temperature/humidity, CO₂, illuminance, flow rate — collects every essential variable of the growing environment without omission.
Sensors Don't Stop at Collecting Data
All sensor data becomes the input for the FarmNavi controller's automatic control decisions and the source data for the blockchain farming log. Measure → decide → act → record is a single flow.
- Flexible on-site network configuration based on RS485, LoRa, and WiFi
- Used as real-time input values for the FarmNavi control algorithm
- Automatically recorded in the blockchain farming log for verifiable history
- A data source for RAG-based AI analysis and prediction
Together with FarmNavi
From sensor to controller to actuator, measurement leads straight to action.
See FarmNaviTogether with the Blockchain Ledger
Sensor data automatically accumulates into a tamper-proof cultivation history.
See the Blockchain LedgerFrom Sensors to Nutrient Solution, One App
Multiple devices and sensors in one app. Click to view larger.

Precise Sensor Analysis
Time series for temperature/humidity, leaf temperature, VPD, dew point, CO₂, and solar radiation

VPD & Condensation Analysis
Condensation risk shown with an optimal band and nighttime shading

Device Selection
Nutrient dosing unit, smart farm, integrated environmental control
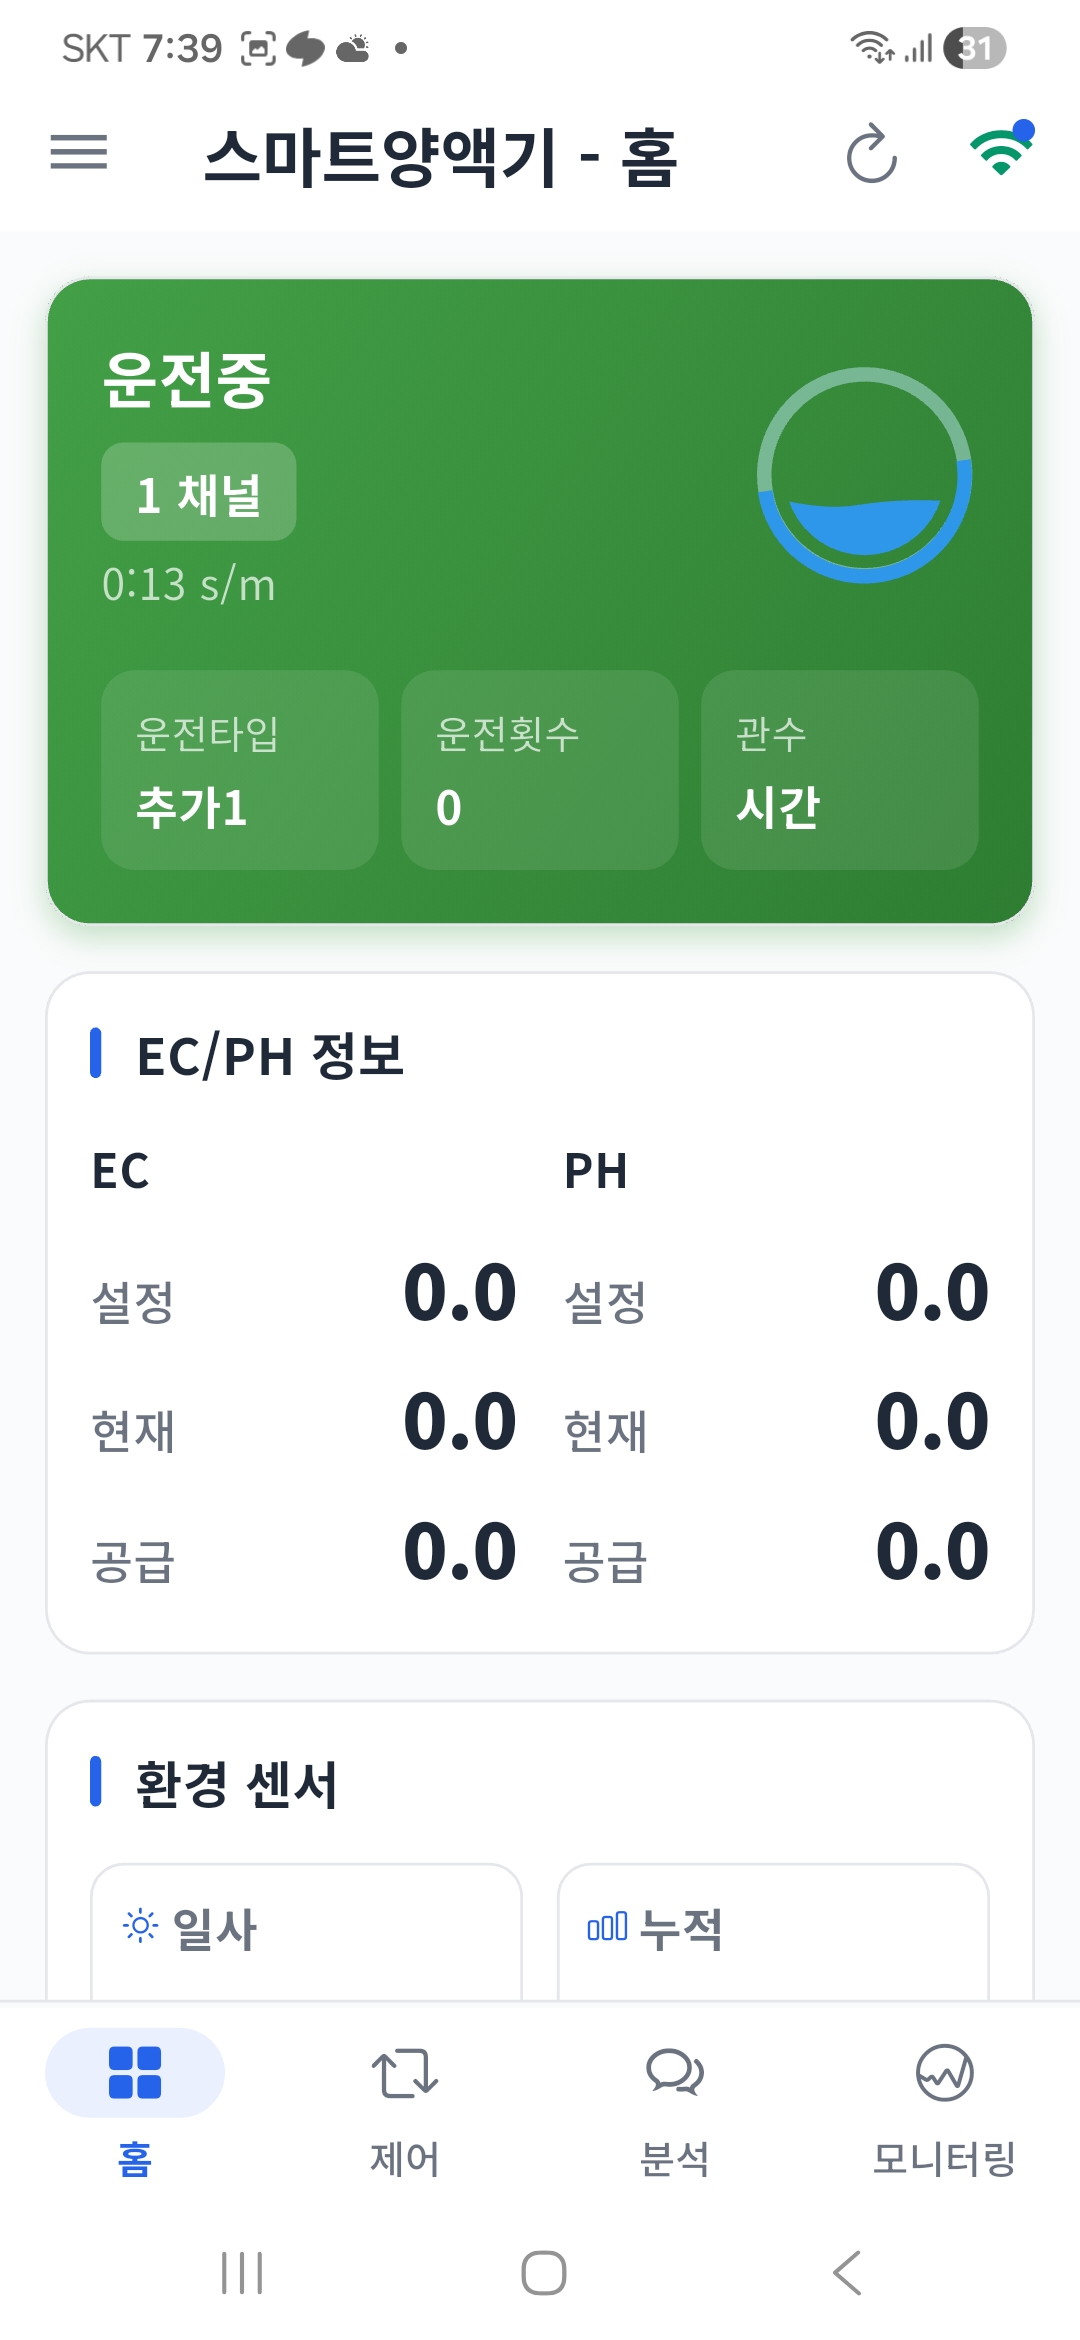
Nutrient Unit Home
Operating status + EC/pH settings and current values
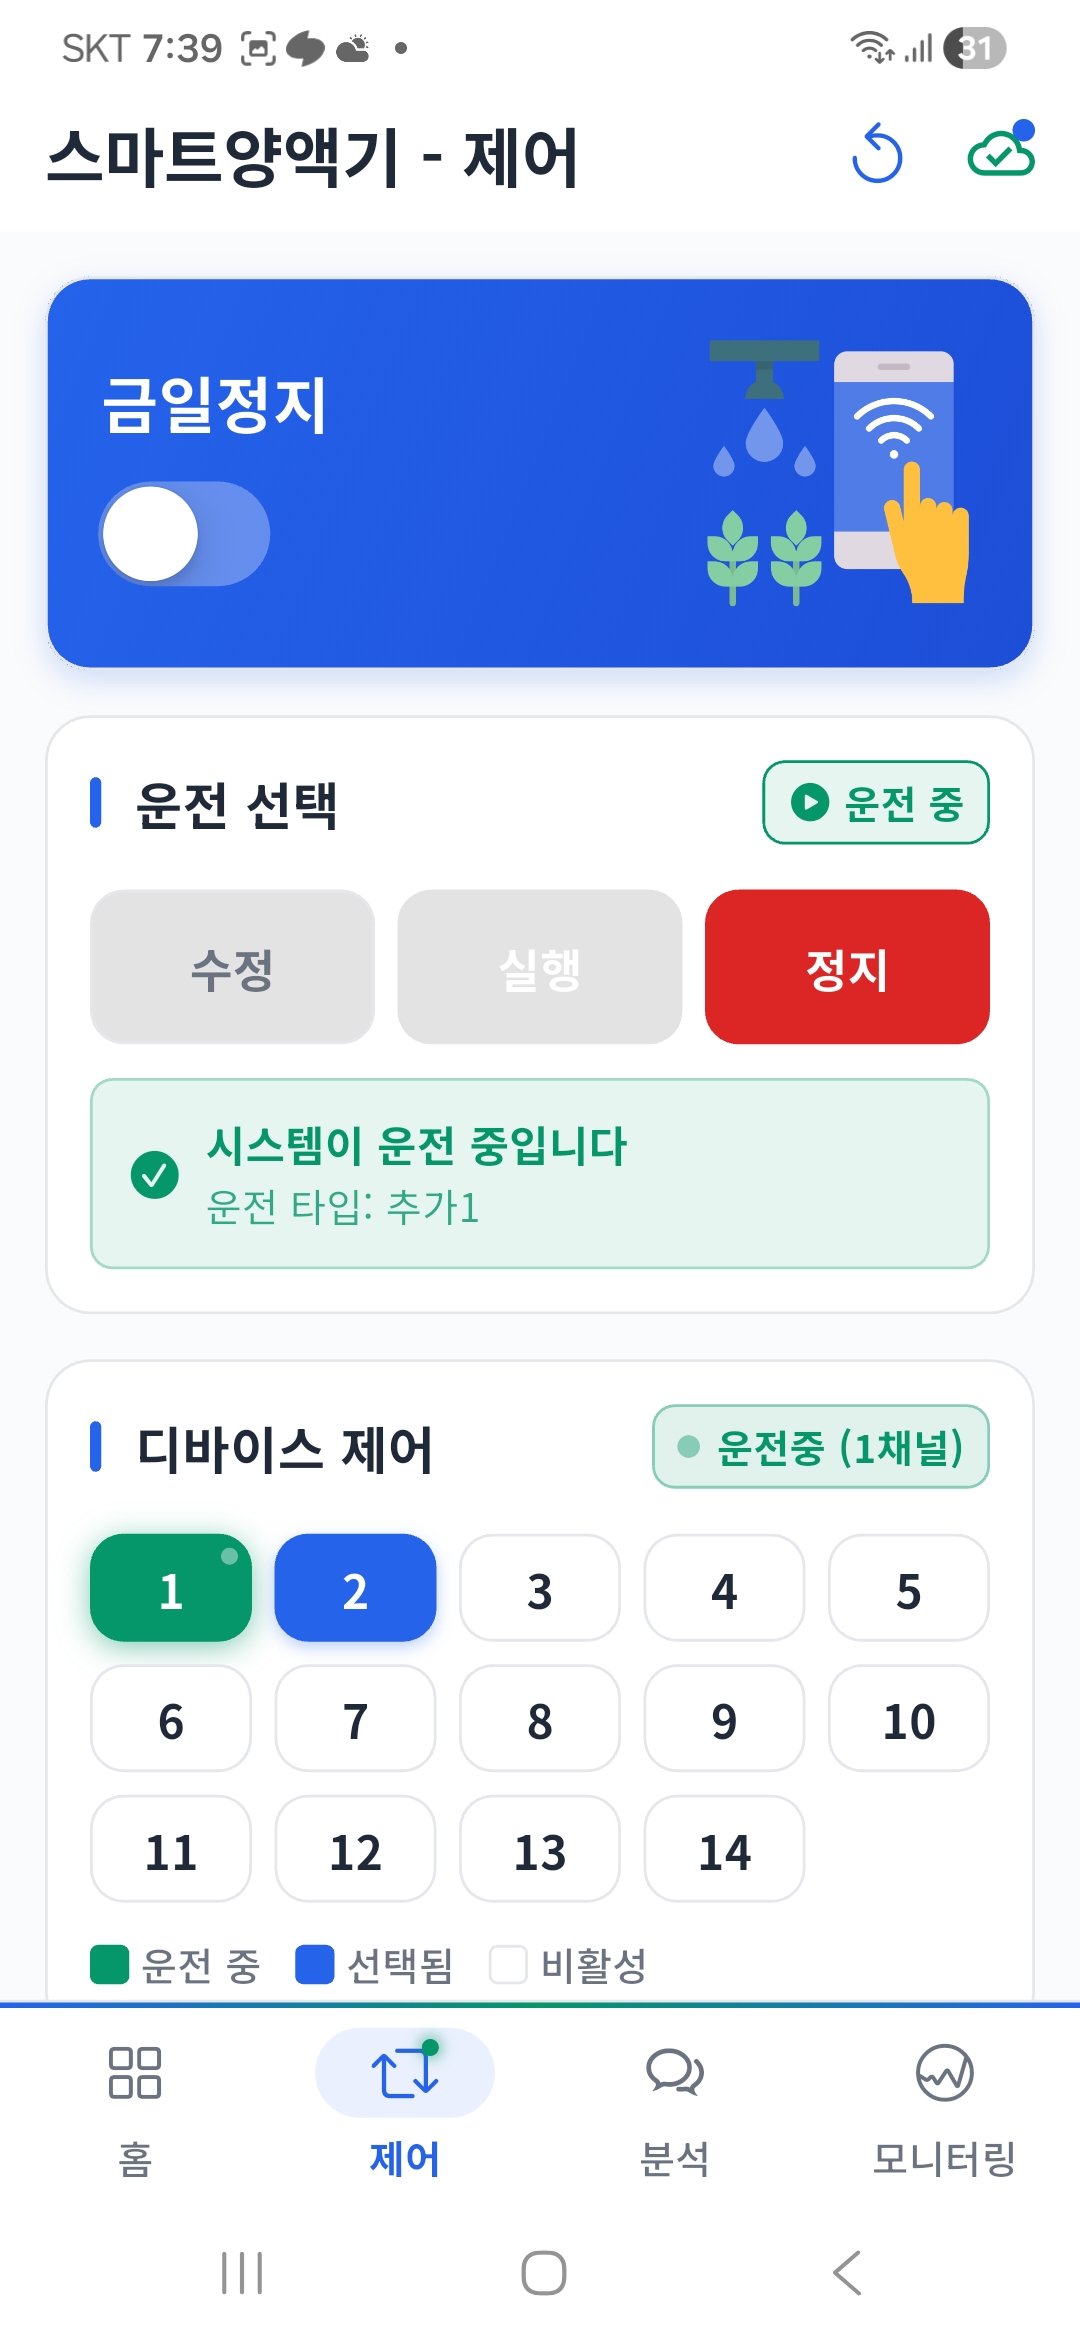
Nutrient Unit Control
Run/stop + channels 1–14 control
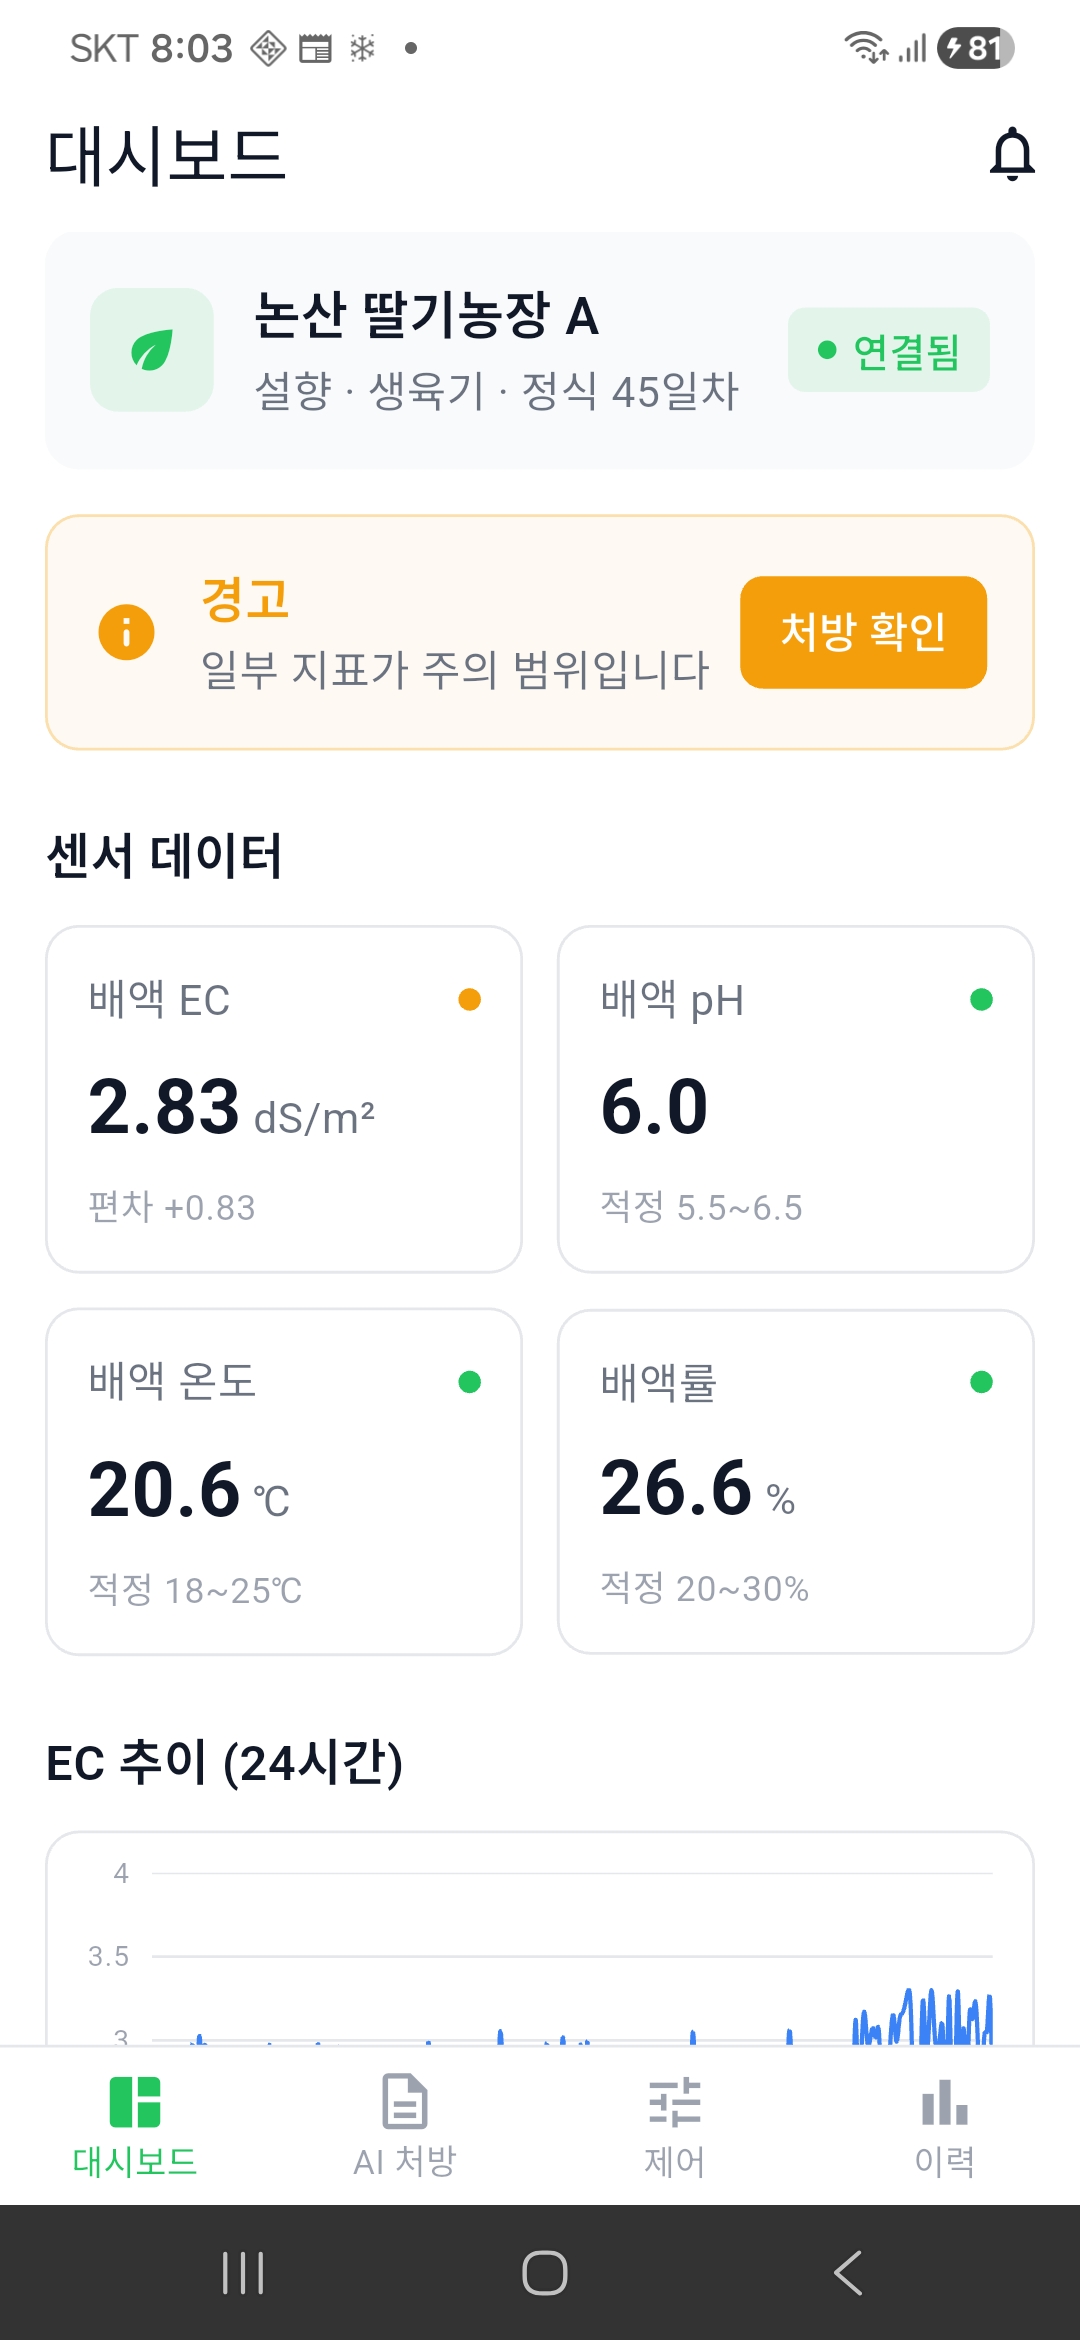
Drainage Monitoring
Trends in drainage EC, pH, temperature, and drainage rate